Specifications
- Spectral selection by common chemical name or CAS number
- Spectral resolution 0.112 cm-1 at full width, half maximum height (FWHM)
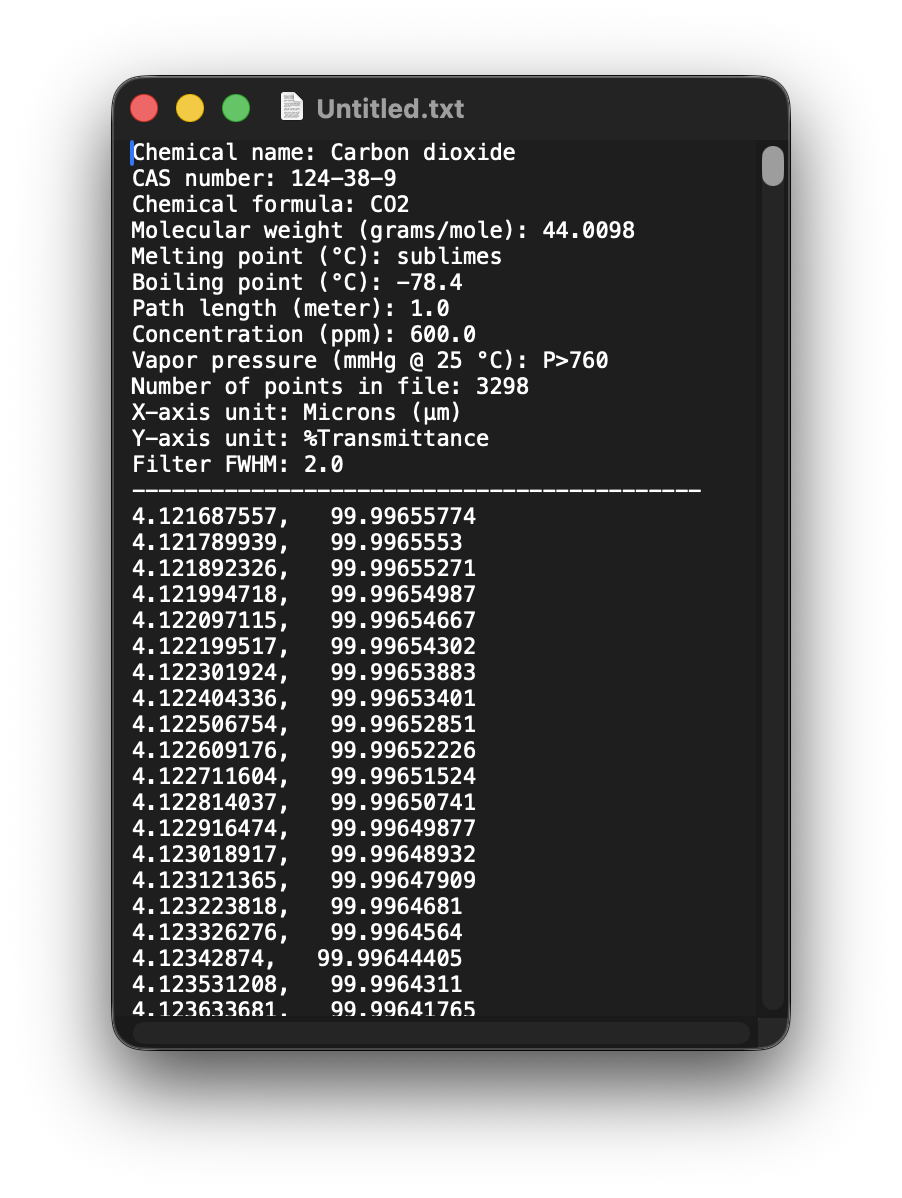
- Includes chemical formula, molecular weight (grams/mole), freezing and boiling point (oC) and vapor pressure (mm Hg at 25 oC)
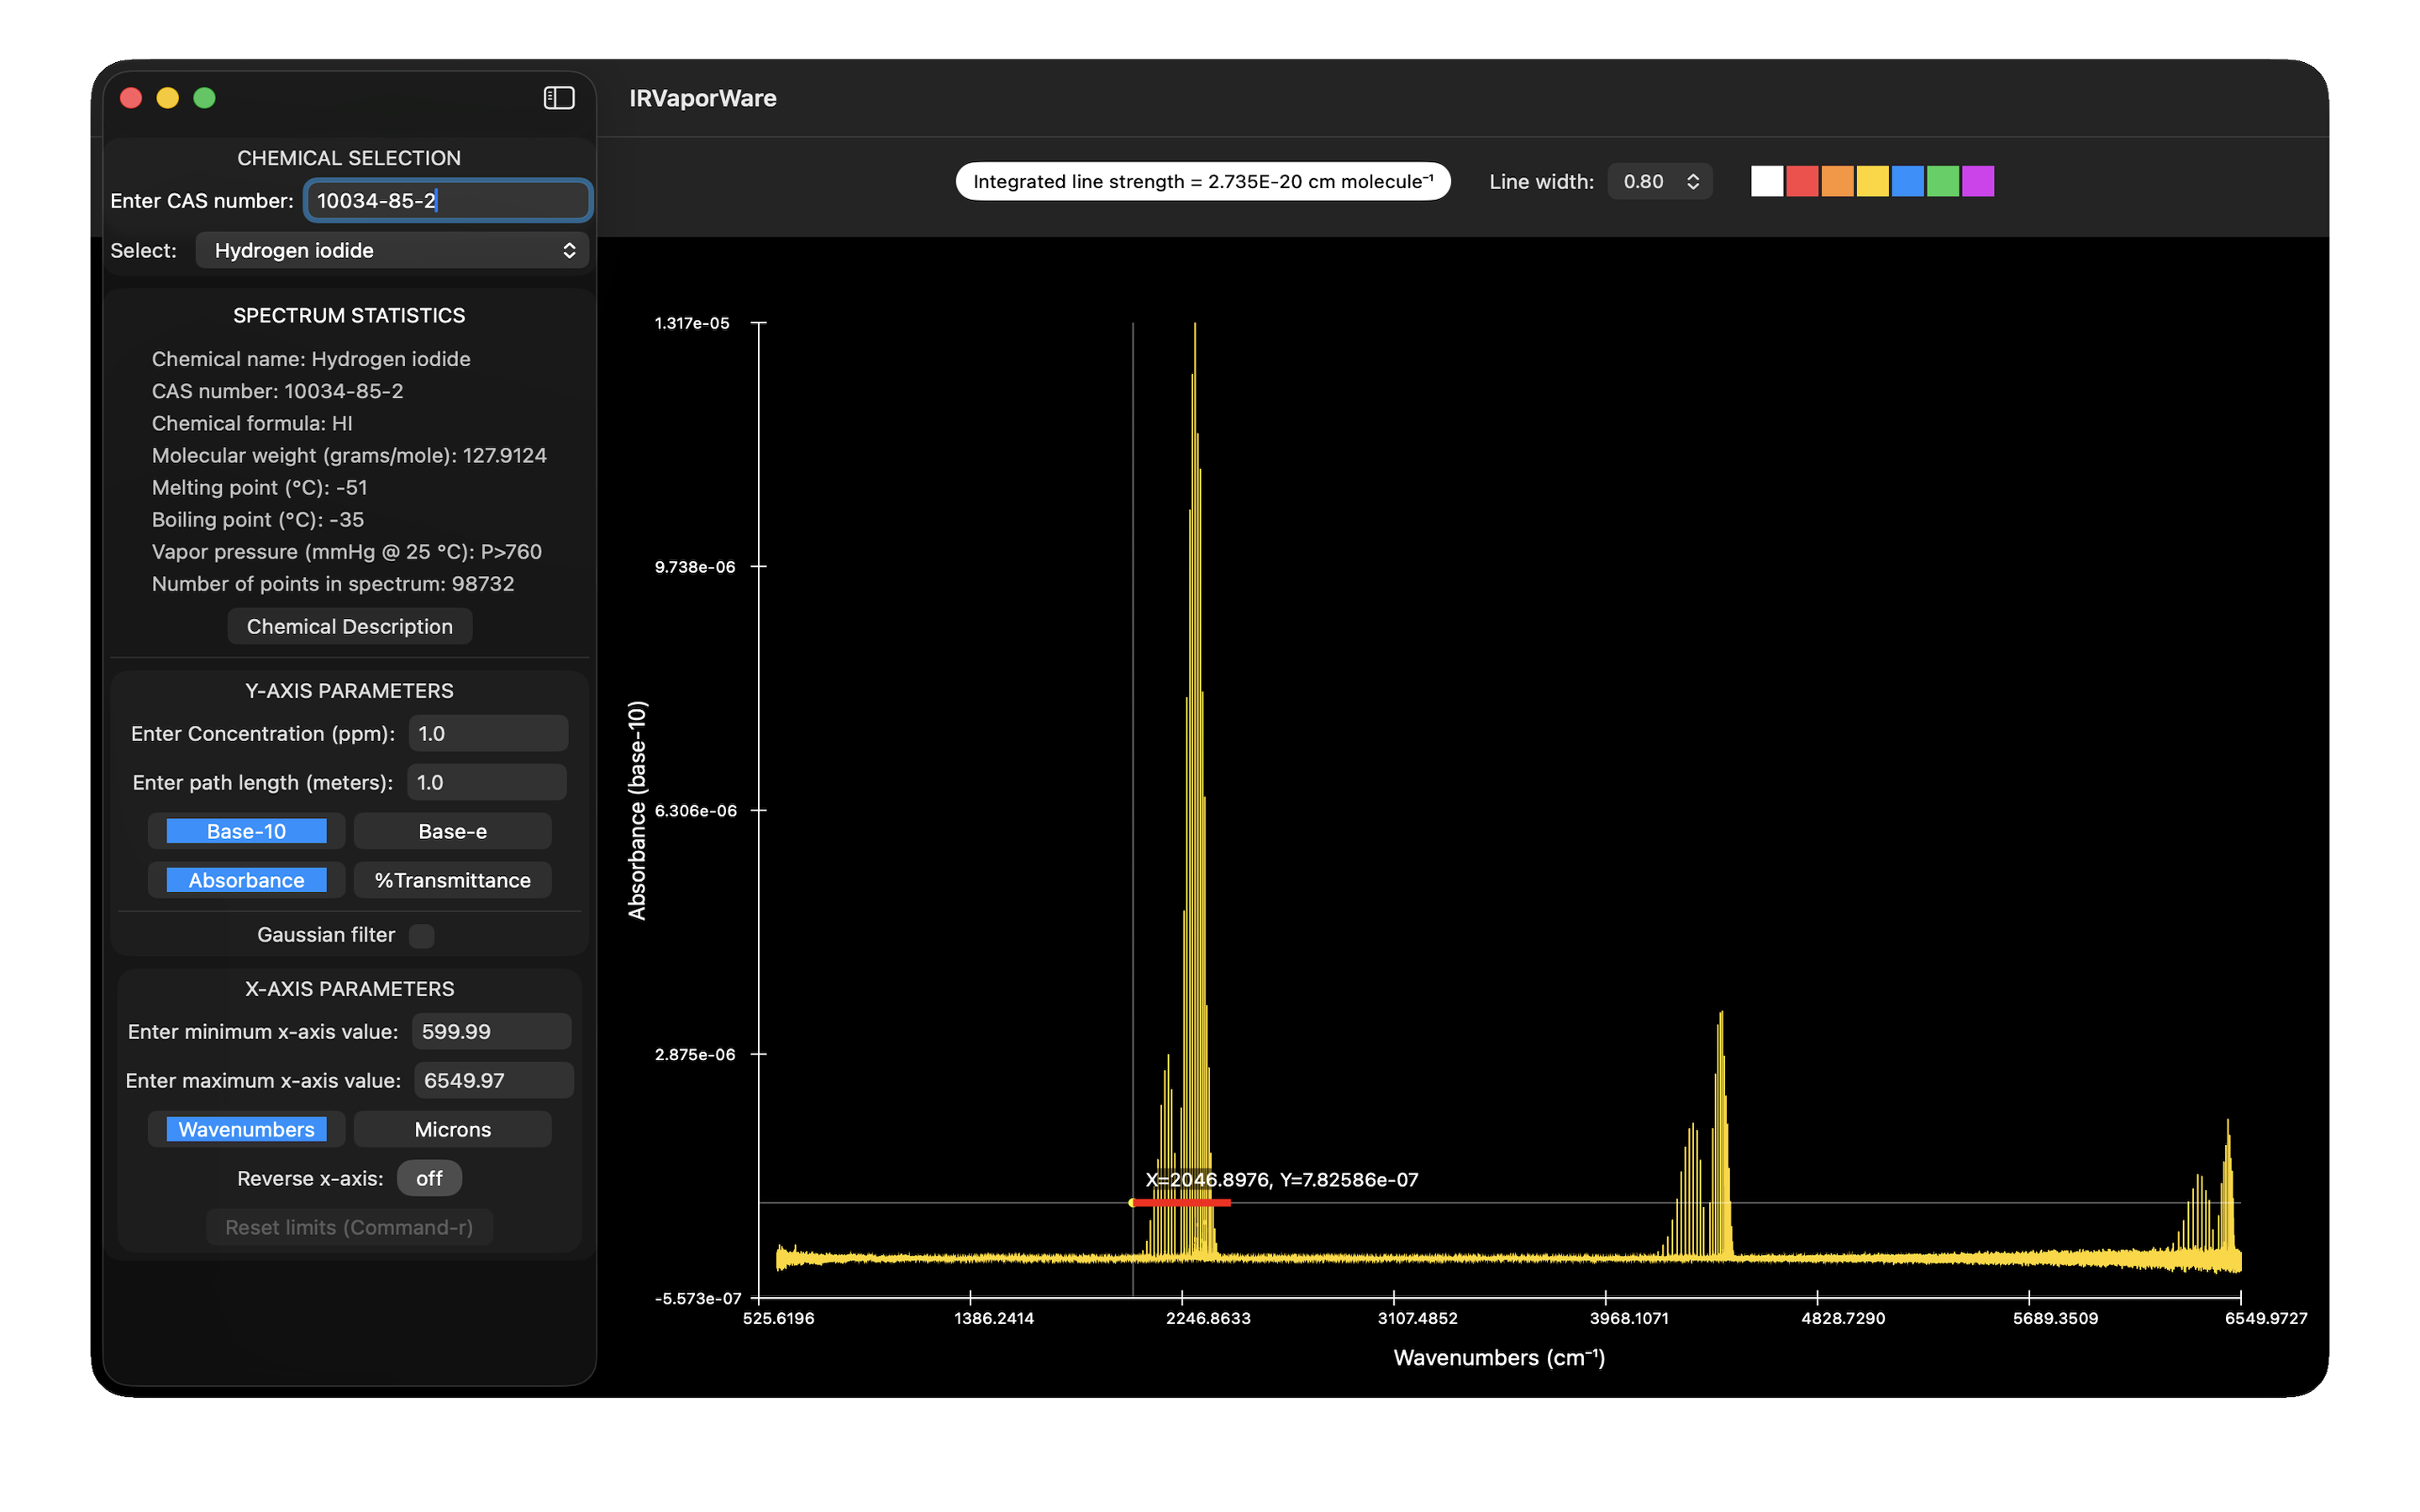
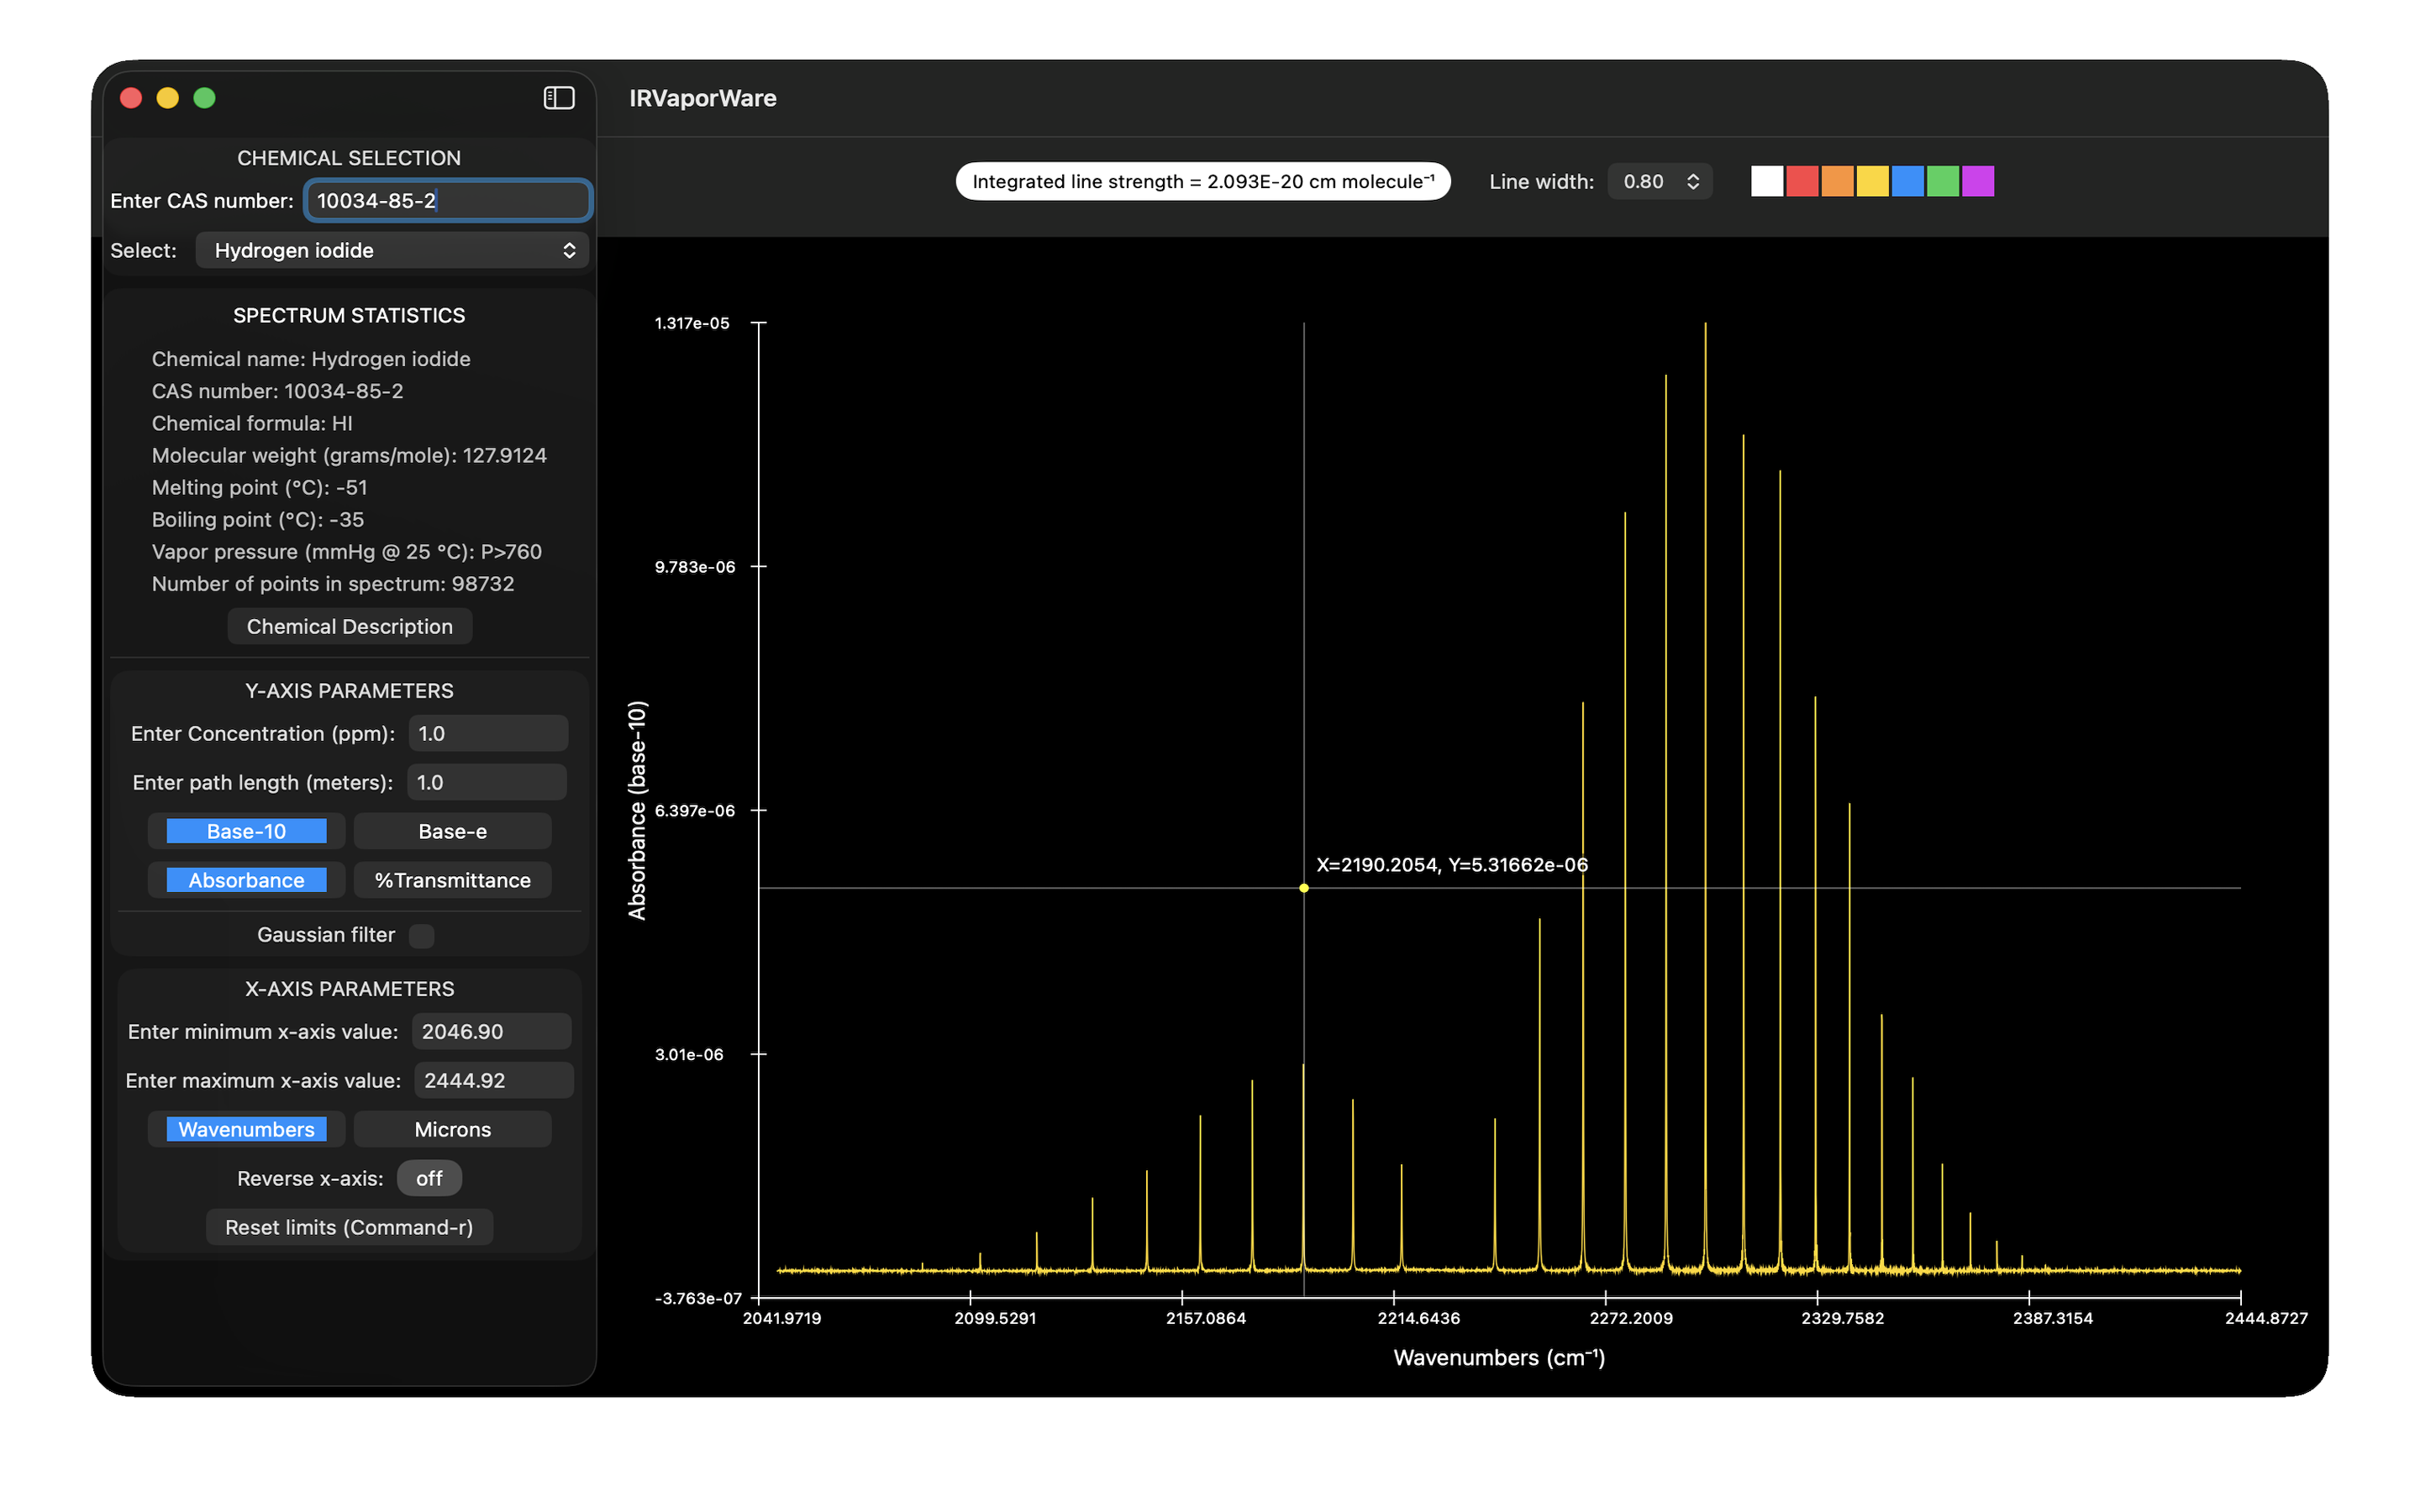
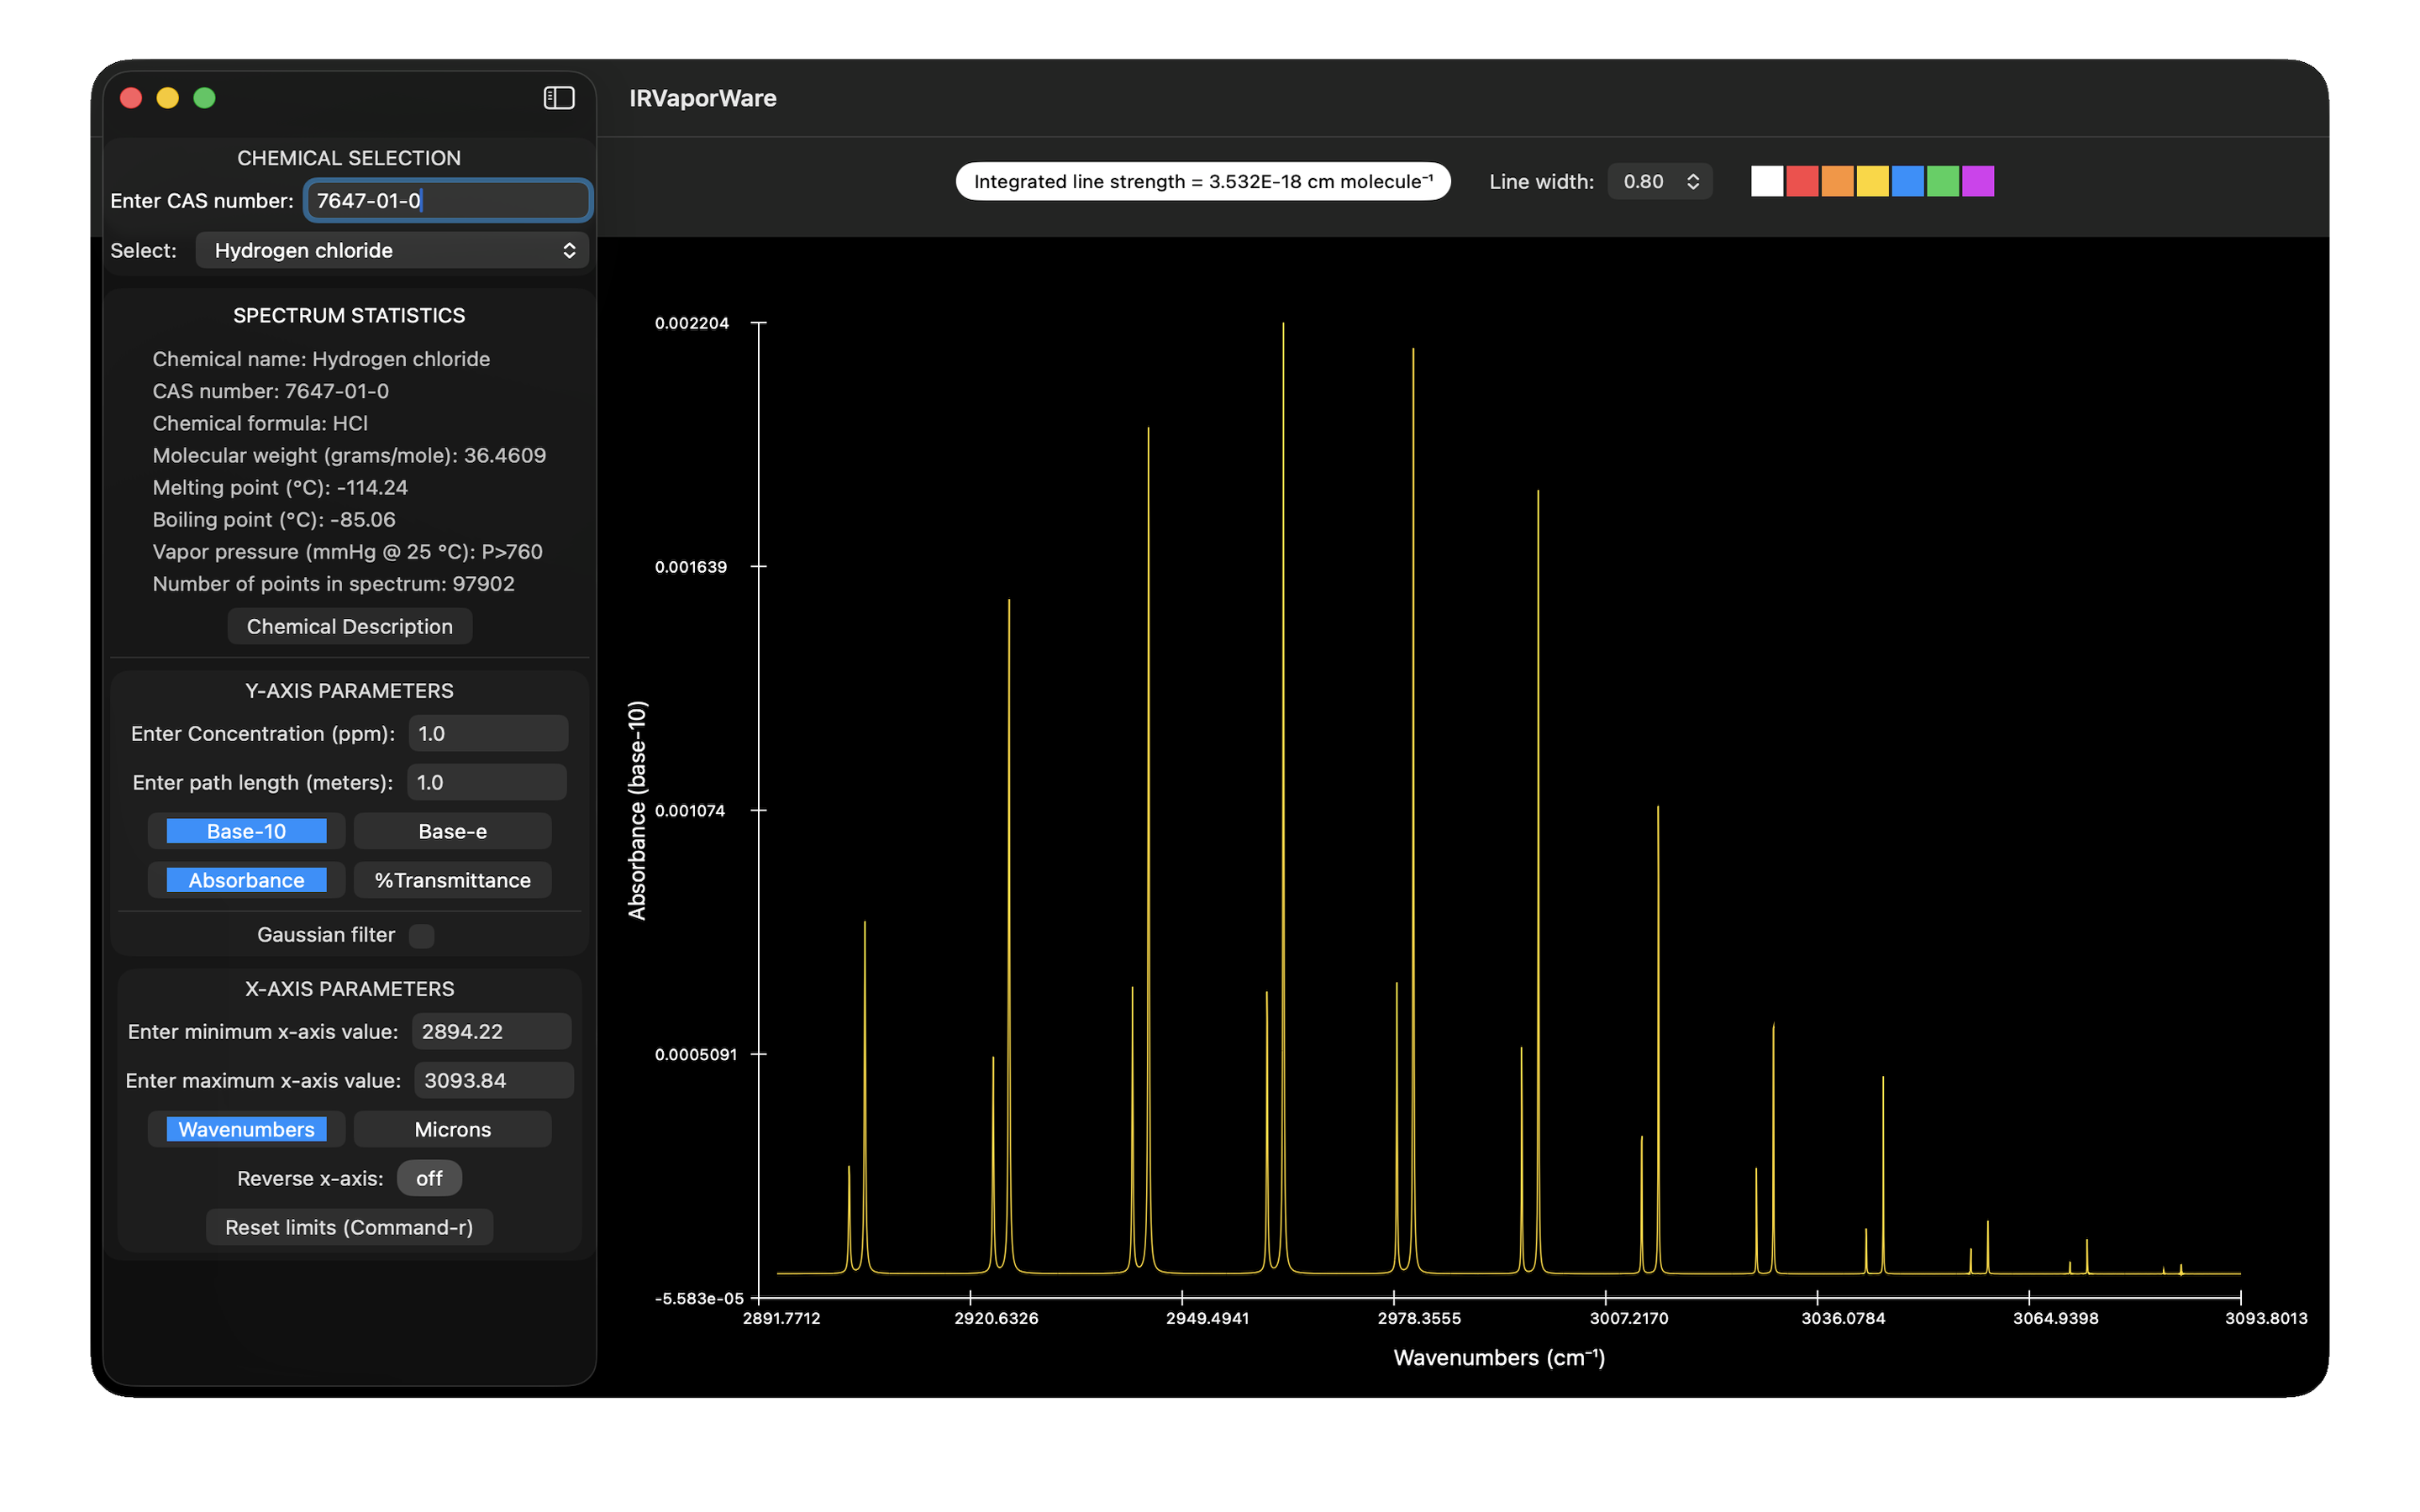
- Display full spectrum (typically 600 to 6,500 cm-1) or user selected range by dragging cursor/finger or entering values by keyboard
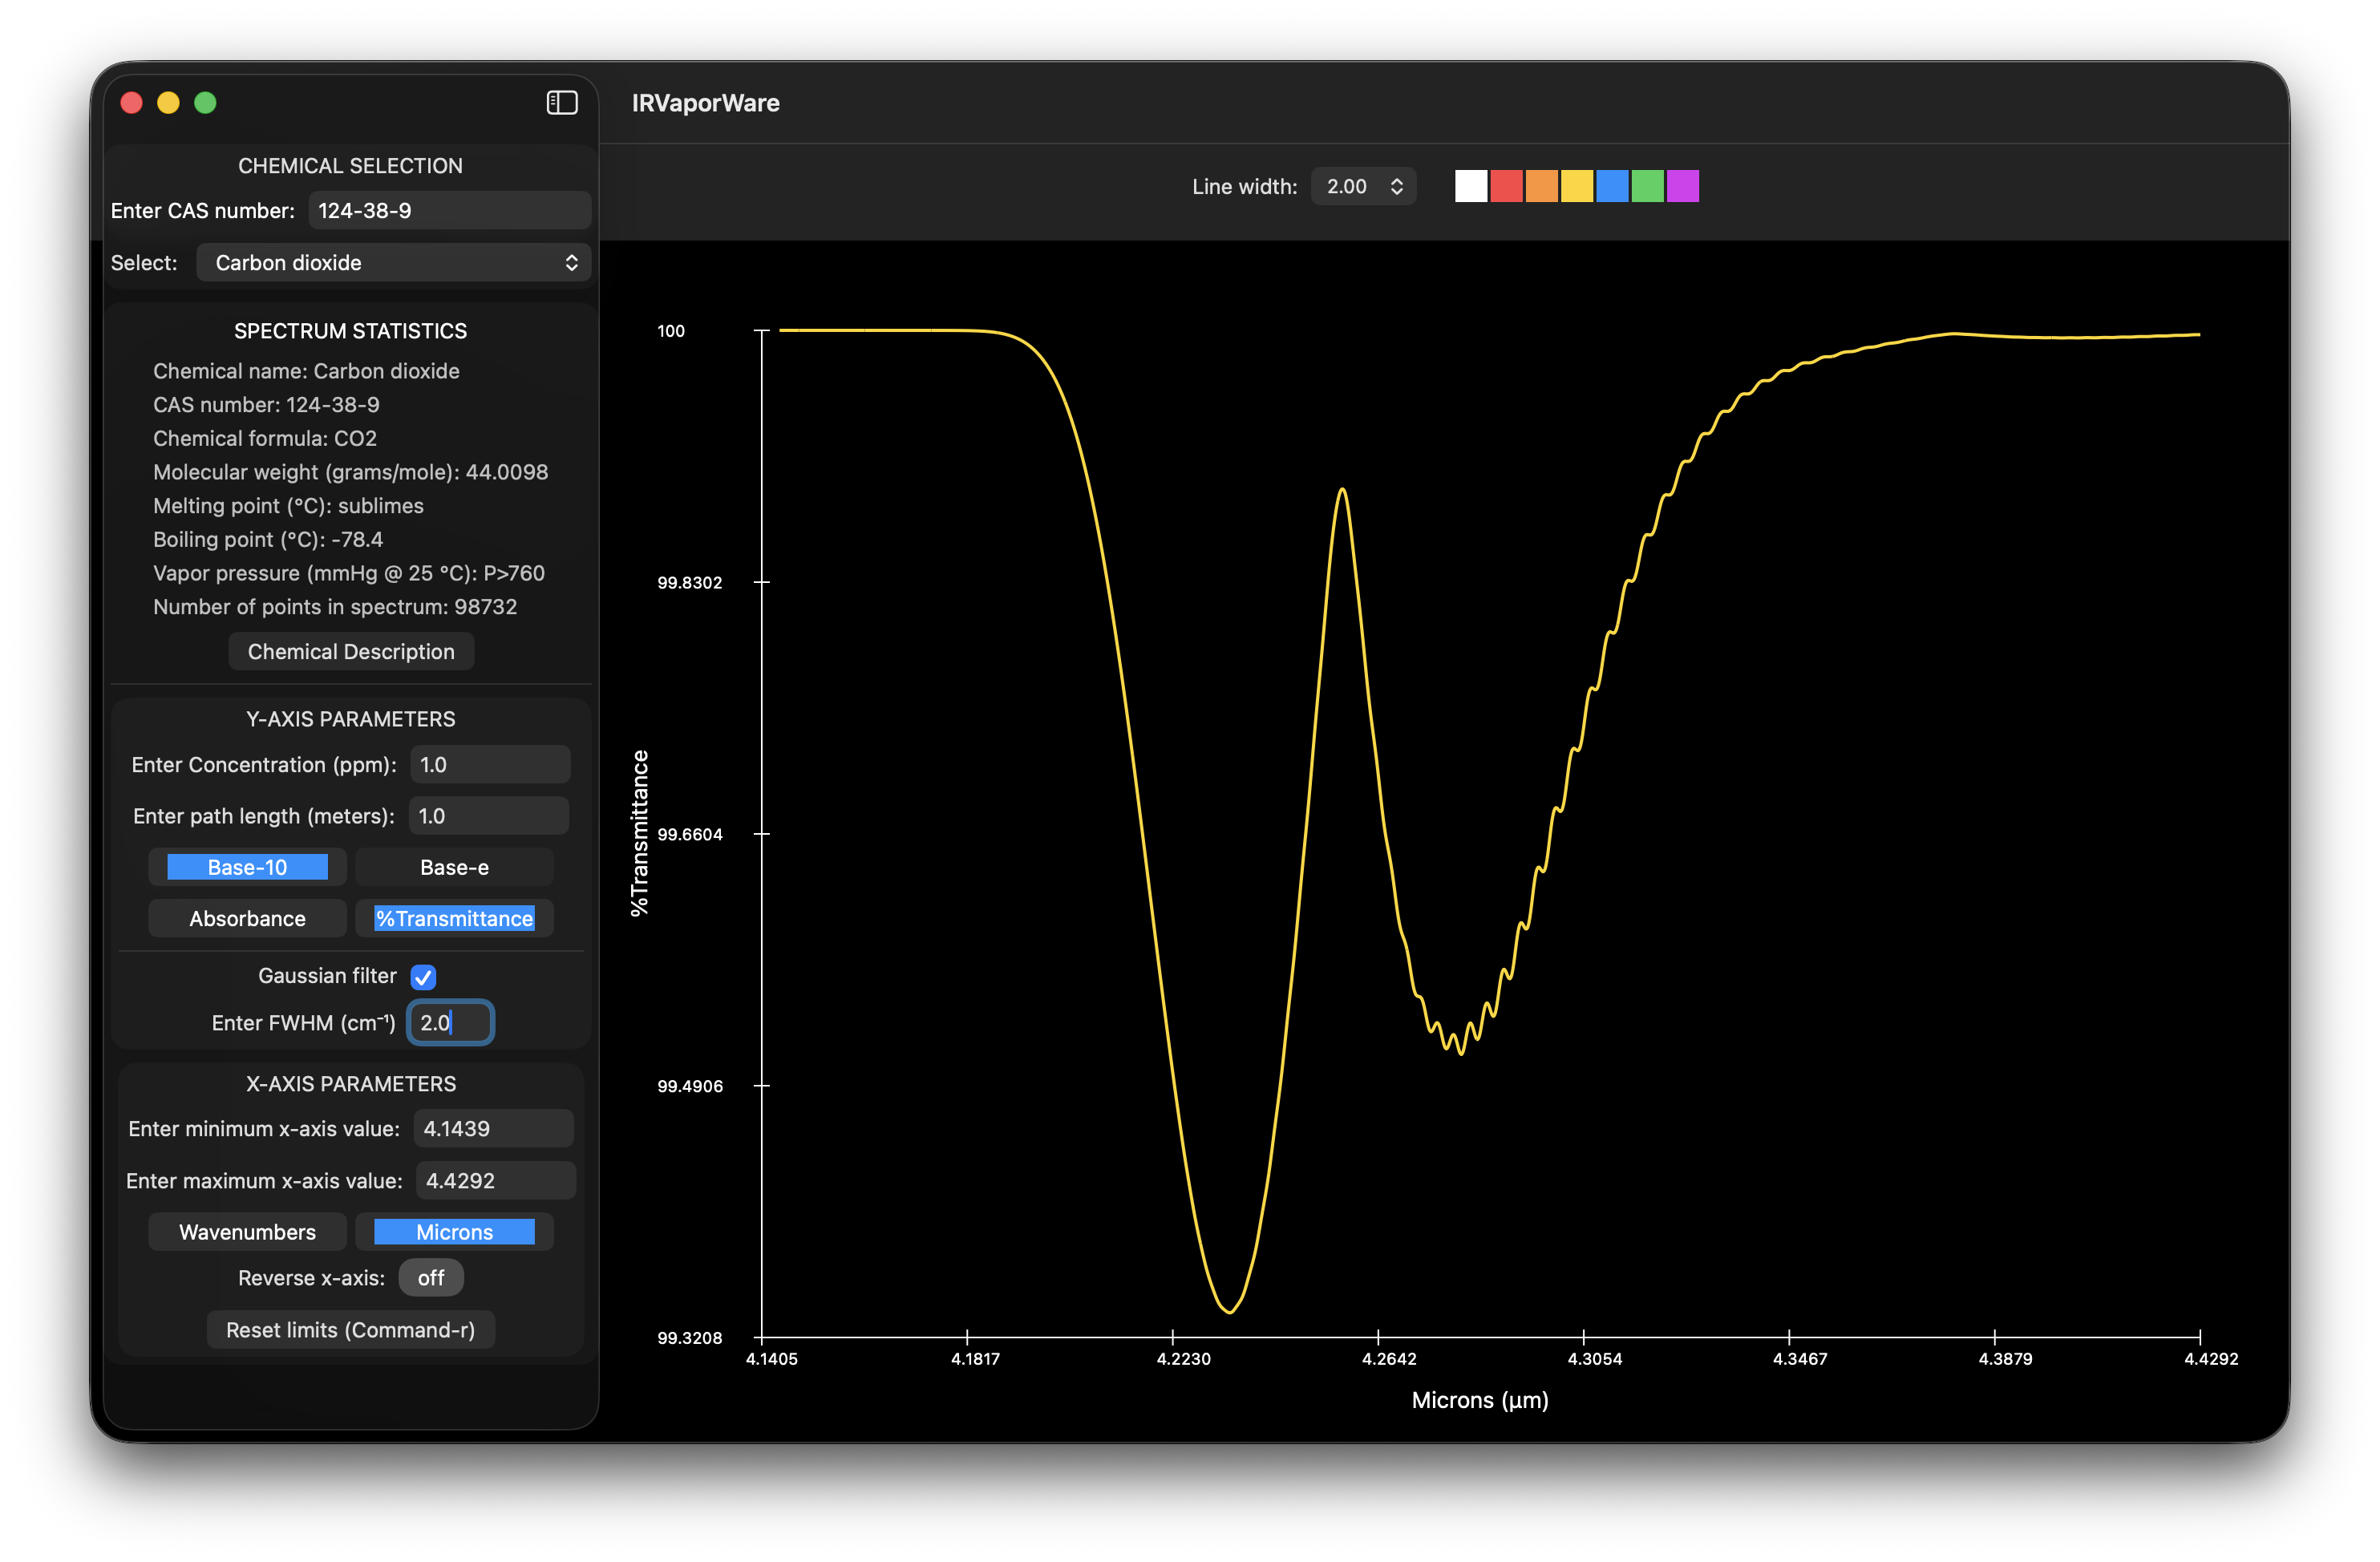
- Switch between Wavenumbers and Wavelength (microns)
- Instantly see integrated cross-section of displayed spectrum (cm*molecule-1)
- De-resolve spectra by convolving with Gaussian filter (0.5 to 50 cm-1 FWHM)
- Change concentration (parts per million) and path length (meter)
- Display spectra in absorbance or transmittance
- Display absorbance in base-10 or base-e
- Display and save spectra as low-to-high or high-to-low wavenumber/microns
- Save entire or selected portion of spectrum, as plain text file
Examples